
Time in Range: Setting Better Blood Sugar Goals
Averages lie. Numbers deceive silently. For families looking for the time in range, Madhumeha Clinic offers personalized clinical care. Expanding your daily Time in Range relies heavily on behavioral habit architecture; read our clinical guide on how to prevent blood sugar spikes using If-Then plans.
For decades, clinicians and patients relied almost exclusively on a single lab metric: the glycated hemoglobin (HbA1c) test. You walk into a laboratory every three months, offer a blood sample, and receive a three-digit percentage. If that number reads 6.8%, your chart receives a green checkmark. Everyone smiles. Yet, behind that calm mathematical average, your body may fight a daily biological storm. Extreme morning peaks give way to sudden afternoon crashes. You feel exhausted, irritable, and lightheaded, despite having a supposedly normal lab sheet.
To take true ownership of your daily health, understanding your HbA1c test results is only the starting point. The modern standard of care has shifted toward a far more revealing diagnostic metric: time in range. By measuring the exact percentage of hours your glucose stays within safe boundaries, this continuous parameter exposes the hidden daily fluctuations that standard lab tests cannot detect.
The Flaw of the 90-Day Average: Why HbA1c Misses Daily Swings
HbA1c reflects the percentage of hemoglobin coated with glucose over roughly ninety days. Because it is a simple arithmetic average, it smooths out every extreme.
Consider two people with the exact same HbA1c of 7.0%. The first person maintains stable blood sugars, rarely drifting below 90 mg/dL or above 160 mg/dL. Their blood vessels experience steady, calm circulation throughout the week. The second person experiences severe swings. Their sugar climbs to 260 mg/dL after breakfast and plummets to 50 mg/dL before dinner. Mathematically, their mean glucose produces that same 7.0% value. Biologically, however, the second person suffers acute cellular damage.
Wide glucose excursions cause oxidative stress in endothelial cells lining your blood vessels. These sharp shifts trigger vascular inflammation, fatigue, and cognitive dullness long before chronic complications appear on standard organ screenings. Tracking your time in range diabetes status replaces this deceptive average with real-time biological visibility.
Clinical Vignette: The Hidden Plunge in an “Ideal” HbA1c
Consider Mr. Arvind Deshmukh (name changed) from Thane, a 49-year-old software architect living with type 2 diabetes.
This patient arrived at our consultation room frustrated and fatigued. His routine quarterly HbA1c stood at an enviable 6.8%. On paper, his glycation markers appeared under control. In reality, he hit a debilitating wall every afternoon around 3:00 PM. His palms turned cold. Sudden brain fog crippled his coding reviews, accompanied by unprovoked sweating and tremors.
We fitted Arvind with a continuous glucose sensor to observe his daily glucose trajectories. His sensor data exposed an alarming reality. Arvind’s “ideal” HbA1c was an optical illusion created by averaging violent daily swings. Each day after lunch, his blood sugar surged to 240 mg/dL. Two hours later, stimulated by high-dose sulfonylurea therapy, his glucose dropped to 54 mg/dL.
Overall, his baseline time in range was a meager 48%. Meanwhile, his daily glycemic variability was dangerously wide, marked by a coefficient of variation of 42%.
Dr. Sagar Kajbaje intervened immediately. We removed the offending sulfonylurea and introduced a kidney-protective SGLT2 inhibitor. Next, Arvind adopted a simple food-first sequencing strategy, consuming vegetables and lean protein before carbohydrates. Within three weeks, Arvind’s daily glucose stabilized. His percentage in range rose to 79%, while his coefficient of variation settled at 28%. The persistent 3:00 PM brain fog vanished completely.
Core Target Boundaries: Understanding TIR, TBR, and TAR
Modern diabetology evaluates continuous sensor traces across three primary zones. Establishing an individualized target blood sugar range helps protect both microvascular organs and daily energy levels:
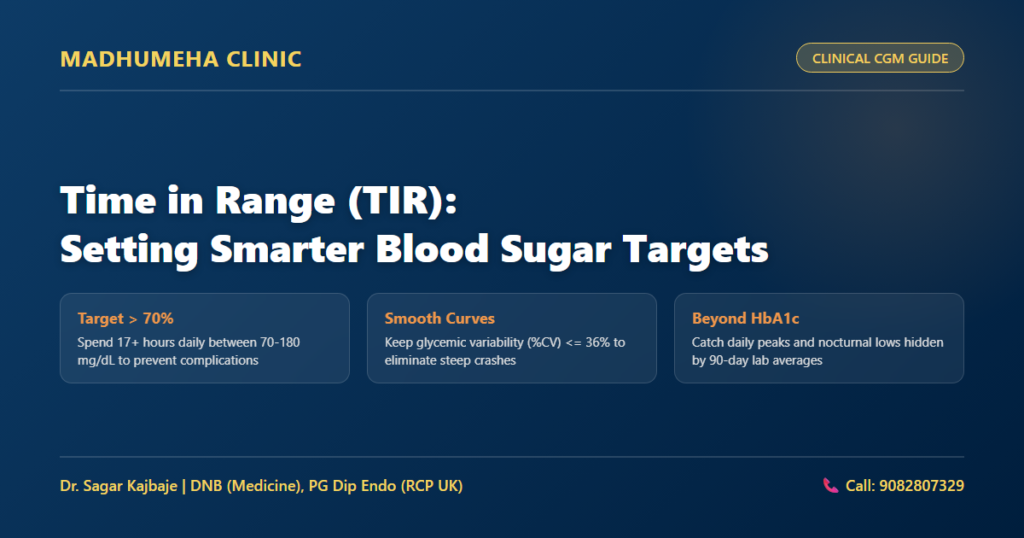
- Time in Range (TIR): The standard target band spans 70 to 180 mg/dL. For most non-pregnant adults with type 1 or type 2 diabetes, the international clinical consensus recommends spending at least 70% of each 24-hour cycle in this zone. Achieving 70% means your tissues spend approximately 17 hours every day free from severe glycemic stress.
- Time Below Range (TBR): Glucose levels dropping below 70 mg/dL represent hypoglycemia. Guidelines mandate keeping total time below 70 mg/dL under 4% of the day (less than one hour). Serious hypoglycemia below 54 mg/dL must stay strictly below 1% (under 15 minutes). Unrecognized nocturnal dips can trigger cardiac arrhythmias and sudden disorientation. You can learn how to protect yourself against silent nocturnal hypoglycemia through proactive sensor alarm calibration.
- Time Above Range (TAR): Glucose readings rising above 180 mg/dL represent hyperglycemia. Clinical targets require keeping readings above 180 mg/dL under 25% of the day (less than 6 hours). Extreme excursions above 250 mg/dL should occupy less than 5% of the day.
Long-term cohort studies prove that every 10% absolute improvement in your time in range reduces your risk of diabetic retinopathy and microalbuminuria by roughly 40%. Consistency preserves eyesight and renal function.
Clinical Diagnostic Matrix: Interpreting Continuous Glucose Parameters
Use this reference table to evaluate continuous glucose metrics alongside your diabetologist:
| Metric Category | Target Threshold | Clinical Interpretation | Primary Action Plan |
|---|---|---|---|
| Time in Range (70–180 mg/dL) | > 70% of readings (>17 hrs/day) | Healthy vascular stability; minimal endothelial stress | Maintain consistent meal sequencing and regular physical movement |
| Time Below Range (<70 mg/dL) | < 4% total (<1% severe <54 mg/dL) | Hypoglycemia risk; neuroglycopenic symptom hazard | Review sulfonylurea/insulin dosing; calibrate bedtime snack composition |
| Time Above Range (>180 mg/dL) | < 25% total (<5% severe >250 mg/dL) | Post-meal spikes; long-term microvascular injury risk | Implement pre-meal bolus timing; adjust carbohydrate density |
| Glycemic Variability (%CV) | <= 36% coefficient of variation | Stable daily rhythm; low incidence of sudden crashes | Eliminate sharp carbohydrate spikes; balance medication profiles |
Glycemic Variability and the Ambulatory Glucose Profile
Tracking the percentage of readings in target tells only part of your story. The smoothness of your glucose curve matters just as much.
Glycemic variability evaluates the amplitude and frequency of your daily swings. Clinicians calculate this using the coefficient of variation (%CV), defined as the standard deviation divided by the mean glucose. A stable metabolic system demonstrates a coefficient of variation of 36% or lower. When your value exceeds 36%, your glucose fluctuates erratically, even if your average seems acceptable.
To evaluate these patterns, endocrinologists generate a standardized 14-day ambulatory glucose profile (AGP). The AGP report collapses fourteen days of continuous sensor readings into a single modal twenty-four-hour curve. It plots the 50th percentile (median line), the 25th to 75th percentile band (interquartile range), and the 10th to 90th percentile extremes. With one glance at an AGP chart, your physician can pinpoint exactly when your sugars rise or drop during typical daily routines.
Clinical Vignette: Overcoming Fear of Nighttime Crashes
Mrs. Meenakshi Iyer (name changed) from Dombivli, a 58-year-old school administrator, struggled with a different metabolic challenge.
Following a frightening episode of nighttime shakiness two years earlier, Meenakshi developed severe hypoglycemia anxiety. To prevent another crash, she purposefully over-ate before bedtime and under-dosed her evening insulin. Her fasting blood sugars hovered between 190 and 210 mg/dL.
Meenakshi’s baseline ambulatory glucose profile revealed a troubling picture. Her percentage of readings in target sank to 42%, while her time above 180 mg/dL rose to 54%. Ironically, her high morning readings were not simple rebound events. They represented persistent nighttime hyperglycemia driven by fear.
During our clinical review, Dr. Sagar Kajbaje analyzed her 14-day AGP modal curves. We observed that her mealtime insulin was being injected after food, forcing insulin to work long after food had already entered her circulation. Dr. Kajbaje guided Meenakshi to pre-bolus her rapid-acting insulin 15 minutes before dinner and adjusted her basal insulin timing. We addressed her early morning blood sugar spikes with a balanced bedtime snack containing slow-release protein.
Within two weeks, Meenakshi’s fears eased. Her percentage in target jumped to 74%, her time above range dropped under 24%, and her time below 70 mg/dL remained below 1.8%. She regained uninterrupted sleep and reliable energy.
Practical Steps to Improve Your Daily CGM Time in Range
Optimizing your daily cgm time in range does not require radical dietary restrictions. Small, disciplined behavioral adjustments yield substantial biological rewards:
- Time Your Meal Injections: If you use rapid-acting mealtime insulin, administer your dose 10 to 15 minutes before eating. Injecting after meals allows carbohydrates to outrun the insulin, causing avoidable post-meal spikes.
- Walk After Meals: A 10-minute leisurely walk immediately after your largest meal activates skeletal muscle GLUT4 glucose transporters without requiring extra insulin.
- Sequence Food Components: Begin your meal with fiber and green vegetables, follow with proteins and healthy fats, and consume complex starches last. This order slows gastric emptying and flattens postprandial glucose curves.
- Review Sensor Trend Arrows: Continuous sensors display directional arrows indicating whether glucose is steady, rising, or falling. Responding to a double-up arrow with water and light movement prevents a minor rise from becoming an uncontrolled spike.
Frequently Asked Questions
What is time in range in diabetes?
Time in range represents the percentage of time that a person’s blood sugar readings stay within an established target window, typically 70 to 180 mg/dL, during continuous monitoring over a 14-day evaluation period.
What is a good time in range for diabetics?
For non-pregnant adults with type 1 or type 2 diabetes, international clinical consensus guidelines recommend achieving more than 70% of readings within 70 to 180 mg/dL, while keeping readings below 70 mg/dL under 4%.
Why is time in range important compared to HbA1c?
HbA1c provides only a three-month arithmetic average, which frequently conceals severe daily highs and life-threatening lows. In contrast, evaluating glucose in range reflects true daily stability and detects acute fluctuations that cause vascular damage.
How can you improve your time in range with diabetes?
You can improve your numbers by pre-bolusing mealtime insulin 15 minutes before food, adopting protein-and-fiber food sequencing, taking brief 10-minute walks after meals, and consulting your doctor to replace medications that cause hypoglycemia.
What is an ambulatory glucose profile (AGP)?
An ambulatory glucose profile is a standardized, single-page medical report generated from at least 14 days of continuous glucose monitoring. It visualizes median glucose trends and daily variation patterns across a typical 24-hour cycle.
Consult a Qualified Diabetes Specialist
Achieving steady glucose control requires personalized clinical guidance. At Madhumeha Clinic, we help patients translate continuous sensor telemetry into clear, sustainable lifestyle and medication adjustments.
Consulting Physician:
Dr. Sagar Kajbaje
DNB (General Medicine), Post Graduate Diploma in Diabetes and Endocrinology (Royal College of Physicians, UK)
Consultant Diabetologist & Metabolic Physician with 15+ Years of Clinical Experience
We offer in-person clinical consultations and structured online diabetes tele-consultation across Maharashtra and India.
Consultation Fee: Rs. 300 (Covers both first consultation and detailed follow-up).
Direct Appointment Line: Call: 9082807329
Medical Disclaimer: This article is intended for educational purposes only and does not substitute for personal medical advice, diagnosis, or treatment. Always consult your physician before modifying insulin dosages, prescription medications, or dietary protocols.
Nutritional Insight: To understand how specific carbohydrates affect your unique body, learn more about evaluating low glycemic index food impact on Time-in-Range using real-time sensor curves.
Related Clinical Guide: Modern weekly insulins significantly improve Time in Range metrics. Explore the complete clinical trials analysis in our once-weekly icodec basal insulin guide.
For a detailed clinical analysis on heart palpitations, silent arrhythmias, and stroke prevention, read our guide on understanding atrial fibrillation and diabetes risks.
For practical chronobiology guidance on night duty routines and meal timing, read our clinical guide on managing shift work and diabetes during night shifts.
To explore the science of food sequencing and preventing daily glucose swings, read our clinical guide on understanding glycemic variability and keeping blood sugar steady.
[…] these daily fluctuations is central to maximizing your continuous glucose monitoring Time-in-Range, keeping your numbers within the safe 70 to 180 mg/dL target zone throughout the day and night. […]
[…] your true daily blood sugar stability beyond a simple 90-day HbA1c test, read our clinical guide on time in range, which explains CGM targets, glycemic variability, and ambulatory glucose […]